There are so many interesting potential trades out there, the list just goes on and on.
With the coming new year, I see the first 3 months of trading as risky and it is best to be prepared for any unforeseen profit taking activities by big funds.
So I narrowed my focus to as few items in my watch list as possible:
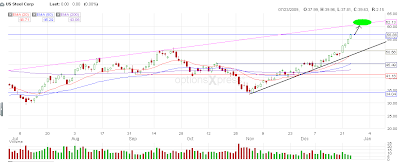
X is still moving, the target looks like the top of the wedge. On any pullbacks back to the black line, it is still a buy
The bonds yields are still on their way up, on any pullbacks it is still a buy. When stocks begin to sell off, yields should come back down....there is still plenty of time before the FED tightens rates
XOM is setting up for a huge move in either direction, the path with least resistance should win...
Sunday, December 27, 2009
Monday, November 23, 2009
Dow Jones and GLD (Nov 23, 2009)
I am going to focus on the Dow Jones Industrial Average the charts are easier to analyse...SPX is a very big index and overhead resistance proves to be quite heavy...not sure if there are any benefits in trading it.
In the near term, I see the Dow moving towards 10552 - 10600.
I am also looking and GLD which I think still have a lot of potential upside. GLD has never reached this high in history, so there is no overhead resistance to be see....it can go as high as long as there is demand.... At the moment 114.28 is the projected target if we use fibonacci projection.
Friday, November 20, 2009
Wednesday, November 18, 2009
EURO (Nov 18, 2009)
A triangle is in play for the Euro, if it does not break out above....trading range could be tight while awaiting a retest of the bottom support line again
Tuesday, November 17, 2009
EURO (Nov 8, 2009)
Euro has formed a Head and Shoulders pattern on the 60 min.
On the daily chart, its is still above 50 EMA...so the uptrend is still intact.
Not sure about you guys, but Head and Shoulders to me is just a guide for projecting the target...nothing more...
The Euro has to break the necklines which can be at so many places....so taking it one thing at a time
On the daily chart, its is still above 50 EMA...so the uptrend is still intact.
Not sure about you guys, but Head and Shoulders to me is just a guide for projecting the target...nothing more...
The Euro has to break the necklines which can be at so many places....so taking it one thing at a time
ES Target (Nov 17, 2009)
Morning folks, we could see another push towards ES 1125 before any meaningful pullbacks. So i will be very cautious not get into any short positions before I see some confirmation of a tradable correction.
Thursday, November 5, 2009
AKS, X (Nov 05, 2009)
I am paying close attention to these steel names for their clearer wave patterns.
Should the US decide to have a second stimulus package or a mark recovery in the automotive sector...these names will benefit from that.
On the other hand, there is ample opportunity on the downside as well...
Should the US decide to have a second stimulus package or a mark recovery in the automotive sector...these names will benefit from that.
On the other hand, there is ample opportunity on the downside as well...
Tuesday, November 3, 2009
EURO - No trend change in sight (Nov 3, 2009)
For those of you who are optimistic about the EURO, be careful with your bullish biases.
Updated Chart 10.51 am
Monday, November 2, 2009
Wednesday, October 28, 2009
SPX - November 10 to 11 a key date (Oct 29, 2009)
Going down to 1012? A rally to new highs in two days seems insane.... November 10-11 is a key cycle date and is also a holiday
Tuesday, October 27, 2009
SPX CCI buy signal, waiting for confirmation (Oct 27, 2009)
I have all along suspected that it could print a doji day today.....so not wasting my energy on doing any trades yet.
Usually when the stochastics gives a signal, it should be a confirmation....the only thing is the stochastics is always 1 day late...lol.
I suspect the overall trend will be determined by the dollar strength
Monday, October 26, 2009
Bounce could be coming for GS and Transports (27 Oct, 2009)
The transports have a confluence of support at around here. So do not be suprised to see a bounce.
GS has a minor positive divergence, it is still trading sideways in a wide range.... Note the doji, ideally we want to see a more narrow ranged doji for us to pick a direction should we get a higher high or lower low.
IWM H and S forming (27 Oct, 2009)
This is a chart of the IWM, you can clearly see a Head and Shoulders forming, in this so called "bull market" bears often fall for the trap of shorting the hell of something that shows this pattern.
I think you need to stay alert for a rally from the neckline. In this case...the first one is around 59.
Friday, October 23, 2009
Watch the Rails (24 Oct, 2009)
The transports appear to be leading this leg down in the S&P 500. I believe there could be a possibility that some rails could retrace up to 50% in November.
Lets start with UNP.
Put action is pointing to a target price of 52.27 or lower.
Of course the other scenario is maybe UNP will stay above 59, we just have to wait and see. MMs who are playing this side of the coin have a lot of margin or perhaps they have already made their money when UNP was on its way down.
As for CSX, option activity seem to point to a possible low of 40.
As for the other two...BNI and NSC I have no comments on them at the moment. UNP tends to be a more speculative stock....so be careful out there...
Thursday, October 22, 2009
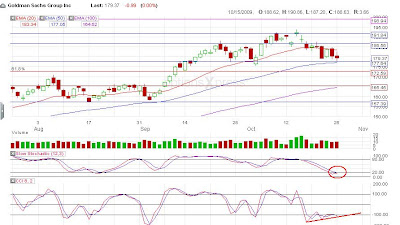
GS options (Oct 22, 2009)
Just wish to share with you on my observations on GS option activity. GS started the descend on the 14th of October.
Imagine if you had purchased a put on the 180 strike price....You will only be be making real money beginning from 20th of October. Amazing isn't it..?
On the other hand, if you have sold calls options at the 190 strike price. You can really see a huge difference....of course...I am not saying that writing calls is for everybody....just look at the gaps downs...if that had been a gap up...that could blow your account....lol
Another way is to buy deeper ITM puts like the 190 strike price....of course that will be more expensive...lol
Imagine if you had purchased a put on the 180 strike price....You will only be be making real money beginning from 20th of October. Amazing isn't it..?
Point is GS made a lower high on 20th of October....but the decrease in volatility on that day made the put options on the 180 strike price seem ineffective.
On the other hand if you have shorted the sector using FAZ, you tend to get a higher high for this instrument when XLF was making lower lows.
On the other hand, if you have sold calls options at the 190 strike price. You can really see a huge difference....of course...I am not saying that writing calls is for everybody....just look at the gaps downs...if that had been a gap up...that could blow your account....lol
Another way is to buy deeper ITM puts like the 190 strike price....of course that will be more expensive...lol
My Strategy moving forward: Watch out for buy signals between 175 - 180.
Tuesday, October 6, 2009
Watch the Euro (Oct 6 , 2009)
Fundamentally, Euro is a currency to watch to gauge the direction of the stock market...whether you are trading earnings or commodity stocks.
Technically, the Euro is still in an uptrend if we look at the daily chart since Nov 2008. If we draw a Fibonacci Retracement from July 2008 highs to December 2008 lows. Notice that the FXE went above the 61.8% level momentarily in Sept 2009 before retracing back below this level recently.
What we should be watching for within the next few days will be whether the uptrend is going to continue if FXE gets above 61.8% again. If that happens then 149 could be the next level of resistance.
Up to now, I still haven't seen any signs of a change in trend unless the 20 EMA starts rolling over. Of course that doesn't necessarily have to be so, it could just hang around right about here and go sideways.
Thursday, October 1, 2009
SPX next level to for bounce (Oct 2, 2009)
We are pretty close to another area of confluence of Fibonacci levels and support level. 1025 is an area that I will be watching for a bounce.
Revised GS possible target (Oct 1, 2009)
Option activity has changed....right now I have revised the target for GS to 180 for a start. At the moment I am relying on technical indicators for a trade.
Wednesday, September 23, 2009
GS, RIG (Sept 24, 2009)
I have been busy trading the indexes lately, as mentioned when you are at such high levels in the S&P...you cannot afford to be complacent. Trust me, I have gone through more than 100 charts and I did not like the overbought conditions at all. So I played safe by playing the SPY....
Back by popular demand, here are couple ideas for this OpEx....all can change if the market gets too bearish....
GS is a buy if it ever hits 175, usually my forecast for GS never works...will see this time.
Watch out for buy signals if RIG hits 80, I misplaced the calculations so will do with just the chart.
Funny Money too needs to be profitable (Sept 23, 2009)
Seeing a lot of funny money in action...? Getting frustrated with stationary market action?
Don't worry, funny money too will one day realize that what they do won't be profitable for them.
There is this perception that, organizations that use funny money to pump this market up can keep doing this forever until the market reaches the moon.... lol. I don't believe so!
Imagine if you were a market maker (MM) trying to get the so called "money on the sidelines" to join in the rally and then sell at higher prices....What will MM be feeling now if no "money on the sidelines" wants to participate at these prices...? Wait until next year? What will MMs do next...?
Hah....there is no need to guess...its just pure common sense.....I see MMs will eventually be forced to "bring prices down to more acceptable levels".
So folks be cautious, don't get overly bullish....for MMs (bull tards) to remain profitable....They need the market to participate...or else they will just be wasting their money propping this market up.
In the coming months, if the market continue like this. I think the options market and stock market will experience significant decrease in volume. When that happens, funny money will have to adopt a new approach.
Thursday, September 17, 2009
SPX fibonacci retracement level confluence
This is a chart of SPX showing a confluence of fibonacci retracement levels from the highs of Oct 2008 - the lows of March 2009...and fibonacci projection levels from the lows of march 2009.
This area of confluence is between 1070 to 1115 with price resistance levels at 1095 and 1109.
Most technical traders pay attention to these levels and I am expecting a test of these levels soon and will be watching out for the next major retracement to about 919.
This area of confluence is between 1070 to 1115 with price resistance levels at 1095 and 1109.
Most technical traders pay attention to these levels and I am expecting a test of these levels soon and will be watching out for the next major retracement to about 919.
SPX Strategy (Sept 17, 2009)
Tiring week, with so many things going on...whoosh.
This market is getting more and more dangerous, even though rallies did happen...but I think the gains per day is too quick. If they are hoping that people will chase the trade....they are very wrong. What used to be 5 day handle rise has been compressed into a 1 day rise. At these levels if you are going long...you cannot afford to be complacent.
Here is a chart of the SPX, it appears that somewhere near Oct 01 - 05 the market could present an opportunity...whether that will be the top or bottom ...hah that I do not know.
The next level of resistance is around 1109.5....that aside we must remember that most of the overhead supply has been sold off and I do not write off the possibility that the market can still go higher. On the other hand, any sell off could be so fast that you will not have a chance to get your hands on the sell trigger. What is the whole point Market Makers/ Stock Gods...? This is no fun.
I am focusing now on conservative swing trade setups and do less trading if not necessary.
Thursday, September 10, 2009
SPX Targets moving forward (Sept 11, 2009)
There is fresh energy coming into the markets, not necessary fresh money. Traders coming back on vacation took the opportunity to buy aggressively when the market dipped to 995...and hence a rally ensued with greedy looking green candles...
Based on the technicals on the SPX chart, there is a confluence of "Fibonacci level - Weekly Pivot Point Level and Resistance Lines" between 1047.16.22 - 1056.30. Note that if tomorrow... SPX goes above 1047, it is likely to attempt 1053 as pointed out by Fujisan.
The next key area to watch if 1056.30 is breached with conviction is 1073.67-1078.98 another confluence of "Fibonacci level - Weekly Pivot Point Level - Weekly 100 EMA" between . That perhaps won't happen tomorrow.
Here is the weekly chart of the SPX:
Smart Money is Selling (Sept 11, 2009)
So are you getting more bullish with today's market action?
Here is just an idea of what some smart money have been up to:
MSFT
CHK - Bullish on Natural Gas??
GOOG
Here is just an idea of what some smart money have been up to:
MSFT
CHK - Bullish on Natural Gas??
GOOG
Trading Plan for Thursday (Sept 10, 2009)
Interesting up trend in the markets for the past few days.....but an important test is coming in the next 2 to 3 days....
Here is a chart of TLT, note the positive divergence in MACD and the buy signal. I think there could be a bounce in the bonds and if it rises above the 20 EMA, we could see the markets halt or slide a little. The ideal target for a bounce is around 92.33 but if we see volume coming in on the bonds then this could go far.
Labels:
3. Strategy
Wednesday, September 9, 2009
Thursday, September 3, 2009
CMED (Sept 3, 2009)
This stock has been beaten down to March lows, I would be watching this stock from now on for any increase in buying volume...The first green shoot was registered yesterday.
Labels:
2. Stock Watch
Tuesday, September 1, 2009
Watch the China and Brazil (01 Sept, 2009)
Feeling frustrated with static markets or lack of decent trade setups...? Who isn't...lol
September is usually bearish for stocks....but for these few years....I wouldn't be counting on the S&P to make any decent corrections for market participants to get in....anyway we shall see.
I think right now, emerging markets is a better play to watch out for the next swing trade. Partly because there is less interference from the government and they can behave more naturally.
Check out these two charts for PBR and CHL....beautiful aren't it?
Labels:
2. Stock Watch
Saturday, August 29, 2009
Trading Plan for Monday (31 August, 2009)
The key point I will be watching next week is the US dollar....which I believe is linked to more to the Yen. Whether the Japanese election results will result in further rally of the Yen or a sell the news event shall be answered pretty soon....
The chart of SPY shows that we have arrived at a significant pivot point yet again.....That is one reason why I exited all my positions. I am expecting either a huge rally or a pullback to somewhere between 101 - 102.
Whichever it is, I hope these MMs won't make life harder for market participants by gaping up/ down....Modern investors aren't stupid, they know the risk rewards before putting anymore money on the table.
I will assume a neutral stance going into next week. Here is my watch list:
SPY, HES, V, FLR
Labels:
3. Strategy
Thursday, August 27, 2009
Market is still moving (August 27, 2009)
For the past 3 days the SPY gave the impression that the market is going sideways....That is true for some sectors but I still see some sectors moving.
Take RTH for example, being the most bearish sector of all...the bulls are continuing to squeeze the shorts.
How about Credit Card companies, aren't they bearish just a week ago....?
How about airlines, isn't there less passengers with the swine flu lurking around....?
There are tons of stocks out there if you could think of a bearish idea..people are bored and looking for somethings to do....no doubt they might get burned one day....But that is how risk management comes in....don't get too greedy and you should be alrite.
Labels:
2. Stock Watch
Monday, August 24, 2009
Trading Plan for Monday (August 24, 2009)
I have been busy lately with my trades, the recent OpEx feels quite different than the previous ones...obviously the MMs game plan has changed.
Lesson learned is to take Option Pain as a guide...it is not exactly the holy grail for option trades..... but it is better than nothing.
From my observation some stocks in my previous posts managed to hit option pain about 5 to 7 days before OpEx day.
FSLR was a notable exception, with more than 20,000 puts....and it makes me wonder how are these MMs hedging their written puts? If that is not the case....some option sellers have lost a lot of money......
I started late on Friday and stayed away for the rest of the day...due to the huge gap up and partially due to my failure to find any decent trades with as minimal capital as possible.
Here is the game plan for the most part of next week, I think you will be lucky if SPX pulls back to 1009...which I doubt..... So, 1018 is still a buy if the opportunity presents itself. Frankly, I don't like this but that is the way it is... If you wanna bet this market will go below 1000...then good luck with you....its month end brother... Eventually...I am expecting SPX to hit 1040...since there is no resistance...."you heard me...loud and clear".
Long Watchlist: EXC, HES
Good luck with your trades.....do your own charting...you are a big boy now.
Labels:
3. Strategy
Subscribe to:
Posts (Atom)