Friday, August 6, 2010

OXY (07 August, 2010)


OXY is approaching an important support zone, this puppy has been trading in a well defined range...

Thursday, July 1, 2010

SPX 980

I spent the night analyzing option chains and concluded that, SPX 980 is a very solid buy if ever it gets there....after all it is only about 45 points from SPX 1024.

From there, SPX could bounce to 1024 then 1050 then 1075 possibly 1100.

Sunday, June 27, 2010

XOM (JUNE 28, 2010)


XOM decline is fast approaching a perceived support around 58.5. Below that, 57- 57.5 could offer some support.

Option activity seems to suggest some form of trading range between 57.5 - 60.


Wednesday, June 23, 2010

Some events affected my trading performance

Recently, some of my family close friends passed away in a car accident....only half the family survived.

This event kinda shocked me for a little while and I felt sad momentarily.

But I already knew how to overcome this sadness.....no problems.... What I did was watch my favourite sad videos all over again to help me get over it.....lol....I am laughing at myself now....

You can try this too if you want to.... Here are the links:
Laura Fabian, Crying Heals the Soul

Monday, May 24, 2010

Copper, Base Metals (May 24, 2010)

Copper and Base Metals daily charts are showing some divergence.

Usually this means a big move is coming, in a bear market this type of setups could end up as a bull trap.

On the other hand, if in fact the uptrend is still intact....then this is a buy signal.


Sunday, May 23, 2010

SPX - possible range trading ahead (May 23, 2010)


Option activity on the SPX is indicating a possible consolidation week.

In one of the scenario that I analysed, we could see trading somewhere near to SPX 1100. All indications point to some form of volatility squeeze play. So keep an eye any rapid decline on the VIX.

On any directional moves, it is still fairly early to tell.


Saturday, May 22, 2010

Bearishnes is still in the air (May 23, 2010)


It feels like there are a lot of bearish stocks out there. From europe to emerging markets, there is not the slightest hint of bullishness on the horizon just yet.

Any bullishness in equities will most likely be driven by hope and optimism rather than fundamentals. Sharp Rallies IMHO should be viewed as potential bull traps.

Here are some charts to show you where some of the opportunities are:

PBR has formed a giant Head and Shoulders.

Fundamentally, this stock has more downside when you see head lines like
"Petrobras board OKs massive hike in share issuance"


On the European end, the TED spread is not looking too good either. US equities has all along tolerated the TED spread during the recent melt up....I just wonder what is in store this time?


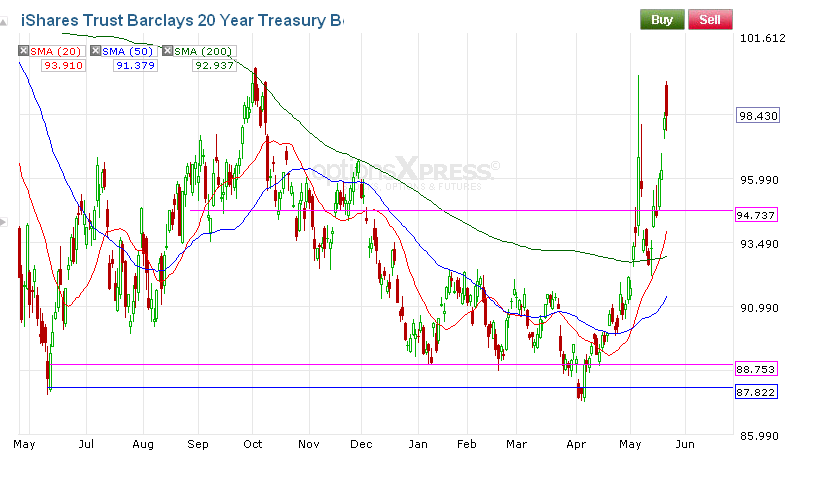
If we consider only US equities, money is still not coming out of US bonds either. Interest rates will most likely stay low as long as it needs to be... There could still be some upside for TLT, watch out for more selloffs in the equity market.

As for GLD, there is nothing bearish in the chart just yet. The recent decline could be due to selling ahead of European holidays. Just need to see what happens when they come back.

Of course, there is always the "World Cup 2010" from 11 June - 11 July. Will these fund managers take a long vacation? Just hope they are not only keeping their eye on the ball! ;)

We must remember that short selling equities may not be the right strategy for the whales/bears to get the best prices in equities....the way I see it...the most effective strategy for them is to move their money into treasuries and assets like gold temporarily.

Friday, May 21, 2010

chaunceyherbie's survey


Click For Results: Spreadsheet

SPX downside risk (May 21, 2010)

I spent the night looking through the charts of major SPX components that pose the most risk in this market environment.


AAPL still pose some downside risk due to lack of consolidation areas below current price.


The rally for JPM starting from JULY was due to optimism for improving earnings. I think there is still a lot of news that has yet to be factored in to this stock. If it breaks below 37, 32 is the obvious target.


XOM, is probably going to retest those lows.


So you see, there is still a lot of downside risk. I wouldn't know where the bottom for this selloff is...but am not writing off a retest of somewhere close to 1036.

Tuesday, May 18, 2010

SPX observations (May 18, 2010

SPX made a hammer candle stick pattern yesterday. Not sure if this is indicating a possible trend change...but I will start looking for any signs of higher low that could lead to a channel in the short term.

Monday, May 10, 2010

Pure Manipulation (May 10, 2010)

What rally in the SPX? This sudden spike in price amounts to market manipulation... Checkout the pre-market volumes on some key stocks, AAPL price rose by 15.64 dollars with volumes of just 103,475?
CRM rose by 4.18 dollars with just 250 shares traded?


Wednesday, April 21, 2010

Key Observations (April 22, 2009)

The S&P 500 index is holding up well despite some selling in Financials, Health Care and Mining Sector.
It is all too clear that some money is moving into Aerospace and Defense and Industrials...and that should hold up the index for the time being.
Some profit taking in foreign markets (Canada, Brazil, Russia, China) were also noticeable.

One key stock that I have been watching is AAPL, I think it is holding up very well and am neither bullish nor bearish on this stock at the moment.
The chart of AAPL has a big gap to fill and this is caused by about 3,850,550 shares at an average price of 250 dollars per share = 962,637,500 Dollars (close to 1 billion dollars)

I see two possibilities for this type of move:
1. Funds are finding a place to hide due to worries that the FED might hike rates in the coming FOMC meeting.
2. Investors/Funds could be thinking that they bought AAPL shares cheap and are hoping to sell the shares to as many buyers as they can. In my opionion, that will most likely not work....and will present a shorting opportunity similar to POT. We shall see.

Moving forward, I see short term strength in Small Caps especially Regional Banks, REITS and selected Consumer Staples.
On the Metals and Fertilizers, I see weakness at the moment...just waiting for strength to develop for some trend trading.

I am also watching UTX, VMW, NFLX to see if there is any follow through of this uptrend. It seems that there is also a lot of call buying in TZA...this could be a very bullish or bearish indicator.....also watching the Russell for any suprises

Friday, April 9, 2010

Base Metal Hurdles


As you might have noticed, there has been some profit taking in metal names like MTL, X, AKS for the past two days.

I usually refer to the DBB to see what is going on in the underlying. The chart shows that DBB is retreating a little with the descending trend line acting as a hurdle to overcome for now.


Wednesday, March 31, 2010

SPX, RUT in focus

Here we are again, facing another key resistance level on SPX and RUT. I don't want to look at the Dow at the moment because it has the least components.

On the SPX, we know that breaking above 1177 - 1180 decisively could bring us to 1191.16. The key resistance after that is 1200.23. So let us worry about these levels for now.


On the RUT, what surprised me is the ability of the market to break through 647 - 675 with relative ease. At the moment 693 is the key resistance level to watch. The chart looks ugly for the region between 693 to 718.53. It looks to me that this the most likely index to pullback first...
Any attempts to reach 718.53 could look more like a grind up.


Saturday, March 20, 2010

Pivot Points

Friday, March 5, 2010

Monday, March 1, 2010

Friday, February 26, 2010

GOOG

Tuesday, February 16, 2010

OX


Monday, January 18, 2010

MRVL (Jan 19, 2010)

Nice chart with plenty of space to move.

Monday, January 11, 2010

Trading Plan for Monday (Jan 11, 2009)

This market has presented fantastic opportunities for some decent trades in the past few weeks.
Index traders have not benefited much though...due to a perceived flat market...which is not true.

If given a choice, of course everybody wants to trade the indexes so that they can do less work on stock analysis...lol. Analysing stocks is a tiring and tedious process and can shorten your life....hehe.

I am really suprised that this blog still has a lot of followers despite me purposely not posting a damn thing for weeks....

This week is OpEx week, so be careful out there...just don't be lured into any unnecessary traps...thats all I have to say.... If you like, you can still stick to some of the stocks that I posted....

After all, why open a can of worms if you have a choice not to do so... Trade safe and trade smart...

If you happen to like drinking Coca Cola....keep an eye to see where this dip will lead to....

Monday, January 4, 2010

Trading Plan for Tuesday (Jan 5, 2009)

GS could retest 176, taking out 180 will path a way for a retest of 190.


MOS is releasing earnings results on Tuesday, will be watching fertilizer names for any side effects.


SPG play could be interesting, at the moment this stock is resting on the 20 EMA on the daily chart. A more prudent buy will be around 74.72, we will see whether 83.83 resistance gets retested soon.