Tuesday, March 31, 2009

This weeks range (April 01, 2009)

Despite the late selling in the SPY later in the day, note the thick band of support between 76.09 - 76.98. Only by breaking this does the SPY head lower to retest the lows.

Right now we are still within a trading range of 78.85 - 81, I hope in the coming days...the price pattern will not map out into a boring symmetrical triangle.

If the market did wanna make an impression to retest the lows watch out for a potential head and shoulders forming. Be warned not to trust any price patterns in this sort of market, hey....price patterns could be engineered....you need to accept the fact.

How many times have you been caught when the market rallies instead when you think a head and shoulders pattern is a reversal pattern...? So let trade the price action instead and stop wasting your time watching out for price patterns!


April will be a daytrader's month (April 01, 2009)

Hi folks, I am aware that there are quite a number of you who come over regularly seeking for some answers about maybe....whats coming next.

Let me share with you, I think April is a month to be very open minded with the market. Because I expect the market to pop and drop more frequently. So don't be overly bearish or bullish and remember to take your profits and learn not to get too greedy.

I sensed that the market was going to rally this morning because I happen to have IBM on my watch list. Frankly speaking I was gonna short IBM this morning, but changed my mind.

This was followed by some skeptical price action on the SPY for the first 1 hour of the day and sure enough the rally started when the financials and the transports joined the bounce.

From today's action, commodities were the worst performer due to cautiousness in the market about tomorrow's EIA report. Week after week, the story is more or less the same. Furthermore, there will be an ECB decision on a possible revision of the interest rate this Thursday. This adds some bearish sentiment on the Euro and will keep Crude Oil prices down for a short while.

The story on the charts still hasn't changed that much...will need to see what happens next

Ok, take care and good luck in your trading.

Sunday, March 29, 2009

Euro is the key (March 30, 2009)


There are talks for ECB to lower interest rates by .50...hence a big tumble in Crude Oil prices back to the 50s.

Without commodities providing support for this rally in equities, the rally has to be fueled from somewhere else. After going through most of my charts most of the equities are touching or right beneath significant levels of resistance.

So I will expect the SPX to pullback coming into April, perhaps it might hold 800 this week but I expect a sell off to somewhere near 796 followed by 770.

However, do be prepared for any surprises especially from the Financials, Consumer Discretionary, Transports to resume any rally.

Saturday, March 28, 2009

GS possible Monday Scenario (March 29, 2009)

Unlike OIH which sold off harder due the strengthening dollar....

The behavior of most financial stocks indicate possible sideways price action at least until the month end window dressing activities are over.

The chart below shows that GS still has not taken out a key support at 106.56. Therefore I am still neutral on taking any medium term short position. If I do go short on Monday, I will likely get out before the end of the day. A break of 106.56 should confirm that GS is heading for 94, 99.


Friday, March 27, 2009

More stocks with more room to go (March 27, 2009)

UPS is enjoying a lot of buying volume lately, will be interesting to see this go higher.


UNP, has a little more room to go.

Will WMT close the gap? (March 27, 2009)

WMT has an interesting setup and I think at some point in time....this stock will hit 55.

Fundamentally this stock has nearly complete monopoly in the retail sector for daily consumer goods. So I don't see why WMT will not go higher.

On the technical side, RSI is showing overbought. Perhaps this should be a candidate to buy on dips.


Wednesday, March 25, 2009

AAPL (March 25, 2009)

AAPL is an interesting stock to watch in the coming days. The most significant resistance I see is somewhere between 107 - 110, beyond that...this stock can go as high as it wishes.

I think AAPL will most likely consolidate around here before any move higher....If there is any significant down move in AAPL could mean that this uptrend is over for now.


Tuesday, March 24, 2009

You are thinking to short again?

Here you go again, still thinking of shorting? Hmmm...Im totally neutral on the market, tomorrow Congress is going to unveil their budget.

If you went short into the close you are just guessing...IMO. Certainly not my kind style of trading....lol.

There is still support at 79.6 - 80.6. If this is broken then you can go short until we reach the next level of support at 76.98.


I do hope you won't let minor pullbacks fool you! The more you short the higher the bulls can prop the indexes higher...Take my word for it.

Tomorrow, I will be looking forward to the EIA report.

Watchlist:
GS, XOM, OIH, JPM, WFC

Monday, March 23, 2009

Not a pretty sight up there (March 24, 2009)

Amazing isn't it where the upward movement stopped....

Let me tell you there are layers and layers of congestion area right above us....I am hoping that the recent sell off to the multi year lows have released a lot of those supplies above us.

Yet I am still hearing some pension funds still holding on to their positions above and waiting for SPX to reach 900 to break even....Its like a dream come true for these fund managers if this happens.

I did not enter shorts at the close, I was thinking maybe it is better to let the market have a chance at testing those highs to see what happens next.

Be warned that there are more resistance lines that could be drawn on the chart...this is just a summary....lol. Lost count of how many!

Sunday, March 22, 2009

Likely targets for SPX (March 23, 2009)

Update 2: SPX should go to 828 then to 866 if we manage to break 806 with conviction (Chart #2).
Update 3: Another scenario is A-B-C with today as a fake (Chart # 3).


I was just curious where SPX could be going next. XLF has held up well last Friday and the VIX showing a shooting star candle stick pattern.

Here is a chart of SPX showing some possible targets within these few days. I think most likely we will head to the 780 - 790 area or 820.

I think the 20 MA needs to catch up with the price action for some form of support. So I favor hitting the 780-790 area first and then reversing towards the 20 MA for some support. Most likely the 20 MA will meet up with the candlesticks at around 732 or 750.

So lets see how this play out on Monday.

Chart #1:

Chart #2:
Chart #3: Possible A-B-C...Maybe

VIX is on its way down (March 23, 2009)

Moving into Monday, I am expecting the market to trend upwards or move sideways with decreasing volatility.

Here is a chart of the VIX showing that it is on its way down.

Wednesday, March 18, 2009

ICE, STT still have room to run (March 19, 2009)

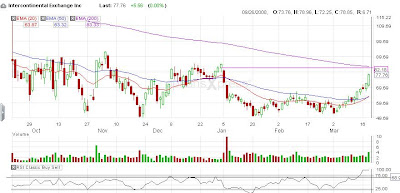
Some typical financial stocks that still has some room to run to fill the gap.


Markets can think, technicals cant (March 19, 2009)

I wish to share with you one observation I made regarding GS. Notice that GS tested 105 today and there was no spike in today's volume. To me, this shows that the sellers are still holding back or they could have sold off their shares when GS was beaten down.

105 is a key resistance because over 112 million share worth more than 12 billion was traded on 18/09/2008.

In the coming days, I see that GS could go higher to test the highs...maybe up to 116
Beyond that, I think GS could possibly reach 150 this year once all the highs have been retested.


I think a similar concept could be applied to MS, the only difference is MS is now free to go for somewhere above 30 at anytime the market is ready to push this stock higher.

Tuesday, March 17, 2009

How these stocks could go higher?

I am going to take a different approach than other blogs to see how this market could go higher.

There are many bears who have missed out of this rally or so called bounce due to their total bearish views of the market.

So far SPX have rallied close to 112 points from the bottom.

On Wednesday we have two key events happening:
1. FOMC meeting
2. Crude Oil Inventories report

For the FOMC meeting, I will watch to see how the market reacts when Bernanke talks about inflation. If the market thinks there will be more inflation ahead of us, then the key trades are
XOM, OIH

For the Crude Oil Inventories, expect a rally for XOM, OIH if inventories numbers are lower than expected. If you so decide to go short if inventory numbers are higher than expected, get out before the end of the day.

As for the Financials, watch the Bonds...if Bonds go lower then it is good for stocks...I expect GS to pullback a little in the morning only to squeeze the shorts later in the day.

Friday is options expiration day, so any pull back from now to then should be viewed as having some potential to turn out as a shorts squeeze.


On the technical side, SPY is close to touching the top of the bollinger band, I suspect the market could still go up until Friday. Otherwise, the market will find ways of going sideways. The RSI reading is currently overbought...though bullish momentum can still push the reading further. If things do make a turn by Monday, this will be a great short opportunity.


My watchlist:
GS, POT, XOM, OIH, IWM

Thursday, March 12, 2009

The bigger picture (March 13, 2009)

I was asking myself why is the rally so damn powerful....it was unlike what we have seen before for the past few months. Then the thought came to me that, the short sellers/ bears are taking profits for most of their shorts accumulated over the months in preparation for the uptick rule.

When we have an uptick rule, each short needs an uptick....so if nobody is selling....shorts will have great difficulty making a profit. I am not saying nobody will want to sell anything....just that we are now at multi year lows. Furthermore, there is so much cash waiting to invest on the sidelines. When they do come in there will be more buyers than sellers. Not many professionals will wanna go short for this simple reason.

Alrite back to some charts.

Just to give you an idea of how high we could go before meeting any key resistance.

Here is a chart of SPY, showing some congestion area above 80.5.


Below is a chart of S&P Emini March, showing that we are entering a "minor congestion zone"....so I would not be surprised to see some consolidation tomorrow. The key test 805 and above. Also notice the much much lower volume on the ES...indicating that this powerful rally caught a lot of people by surprise.

Friday Ideas (March 13, 2008)

We have a major economic report tomorrow. That will be the real test for this uptrend, what I am looking forward to see is whether the "Bears" are really running scared. If the report is so bad and we still rally, then we should see the Dow and SPY rally like mad in no time.

Here are a few ideas that I have

WFC, JPM looks as though they are ready to shoot to the Moon. After that sell down to the 660s, I think a lot of supply has been released.


A few ideas for Thursday (March 12, 2008)

I have been watching a few interesting stocks.

One of them is AAPL, on the chart below...notice how the shorts have to cover each time AAPL gaps up above the congestion zone in squares. There are two more congestion zones above, so keep an eye on those. We probably might see AAPL retrace a bit to the 50 MA, we shall see if not this stock can still run up. Lets see in the morning if there is any gap up to scare off the shorts.


GS is another stock to watch for a gap up or it could keep going up to the 96- 98 range. If not this stock has probably topped for now, then I would expect a retrace back to the 50 then the 200 MA in 3 to 4 days time.


WYNN is probably a good stock to trade when you feel bored with high beta stocks. I like to trade WYNN if I have the free time.....lol.


Here is another, ACE. This stock has a habit of liking to form wedges. If you feel bored with S&P try this for a change....lol

Wednesday, March 11, 2009

Take GS and MS as just a trade (March 11, 2009)

I almost lost sight of the fundamentals due to this rally.

Let me remind you that GS and MS is reporting their earnings at around March 17/18 so don't buy and hold. There will be plenty of opportunity to buy on dips after they report their earnings.

For any financials, I will just consider them as a trade. I like GS, MS

Update 1:
For this long play, I like AAPL, IBM, MSFT, CAT, FLR, XOM, CVX, FCX.

Update 2:
I think these stocks still have room to run on the upside SYNA, BNI, FDX, CAL

Tuesday, March 10, 2009

Uptick rule brings a whole new ball game (March 11, 2009)

I have to say I was a bit frustrated with today's action.

The morning started with a huge gap up bringing RSI and stochastics to an instant overbought reading. The market shot straight up without looking back. In fact I was hoping to get some decent entry on some dips....but never got the chance. Even the MACD failed today because it was giving all the wrong signals indicating a SELL....? So I decided not to chase the rally.


All together there are 3 wave counts thus far, so if wave 3 has completed....we should have some sideways movement or a retracement as wave 4 for tomorrow. That will be a good entry to buy on dips to catch the move up of wave 5.


The main story today is the return of the uptick rule in a months time. When this rule is brought into effect, I have a more bullish bias towards stocks because the shorts will have more difficulty beating down prices of stocks. So my suspicion is, MMs might try to beat down stocks before the uptick rule comes into effect that could possibly give us a double bottom.

Tomorrow we have the EIA report, so afterthat we should get an all clear signal to trade DIG or OIH related stocks. Crude Oil is down today because the OPEC news is over for now. We are back to the fundamentals of supply and demand for Crude Oil related trades.

My watchlist:
XOM, GS, MS, AAPL

Monday, March 9, 2009

Crude Oil could be due for correction (March 09, 2009)

Crude Oil prices have climbed for the past week, inventory numbers are moderating.
However, it gives me the funny feeling when DIG, OIH is still in a downtrend.

This could be buy the rumour sell the news trade due to further OPEC cuts.

If you asked me, I think it is time to short crude oil. You can do this through some etfs like DTO, SCO.

Here is a chart of Crude Oil showing wedge forming.

Sunday, March 8, 2009

SPY - possible turnaround level (March 09, 2009)

SPY is approaching a possible intermediate bottom at around 64.73 - 65.27. That happens to be slightly lower than the down trend channel.

I think any move up on Monday should be treated with caution and you should take some profits as we get nearer to the top of the channel. So do keep your positions smaller until you see a confirmation of any change in trend. The top of the channel happens to be SPY - 70.28

I expect a possible correction on Monday morning due to an overbought RSI condition on the minute chart. As usual I keep no biases....the market usually does things in a less obvious way.


One thing for sure, a rally is coming....so do keep your eye on the financials.

My watchlist:
SPY, GS, OIH, GLD, XOM

Thursday, March 5, 2009

Some ideas for tomorrow and Monday (06 March 2008)

I did not trade today due to a mistake of my own of reading other people's blog... Should have followed my own rules from the start.

We are getting closer to the bottom of the channel on SPY, if the jobs report tomorrow is bad I am expecting a gap down to either 66.31 or 67.86. We could then see a decent bounce from there. Make no mistake, this might not be the bottom...just follow the flow of the market. Some technicians say 60 could be the intermediate bottom.


My watchlist:
IWM, GLD, GS

Wednesday, March 4, 2009

SPY - Possible target (March 05 2008)

I sense that SPY might try to hit the upper trendline of the channel. If not then we should trade sideways for a while.

Tuesday, March 3, 2009

Get ready for some Theta Burn (04 March 2009)

Updates: ES sold off sharply and rallied hard from there, European stocks are rallying. Going long only from SPX 682

We may begin the countdown to OpEx from here for March Options, it is only 17 days from here. I don't like to be overly bearish or bullish because I hate MMs dirty tactics of trying to maintain prices at these levels. Ideally, you wanna be delta neutral in this kinda scenarios.

I was actually hoping that SPY finish the day with a high stochastics and RSI reading for a final capitulation tomorrow.....unfortunately that did not happen. Instead the readings point to a possible gap up or sideways actions tomorrow. Hence, I don't think that the major indexes are going to get very far to the upside or the downside.


Perhaps, if the range is wide enough...this could potentially become a daytrader's paradise.
If I were you, I will try to avoid the chop for a while unless I see a tradeable range.

Good luck.

Watchlist:
GS, POT, RIG, XOM